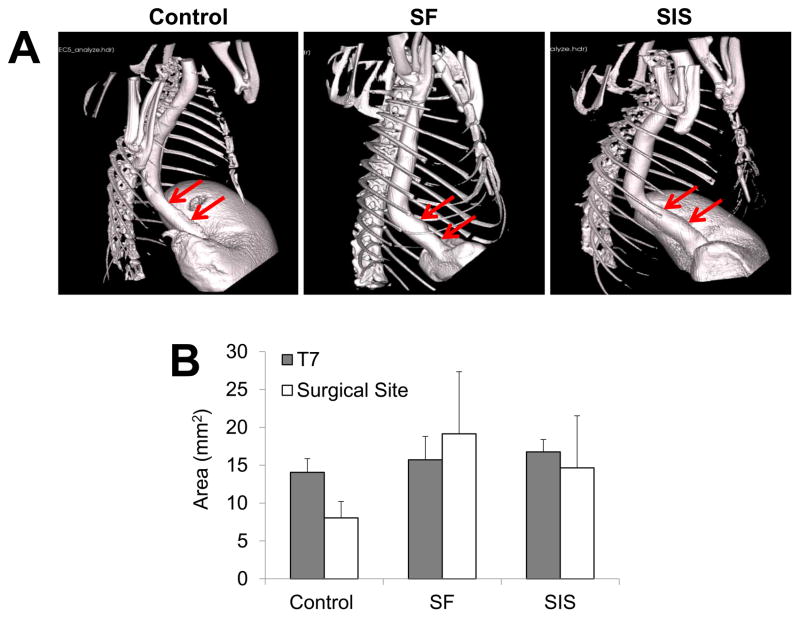
Figure 4. μCT analysis of esophageal continuity in implant and sham control groups.
[A] Representative 3-D images of esophagi in experimental groups at 2 m post-op following contrast gavage. Arrows denote boundaries of original graft anastomosis or esophagotomy in controls. [B] Quantification of luminal esophageal cross-sectional areas from the central region of the original scaffold anastomosis or esophagotomy in controls (surgical sites) as well as a nonsurgical reference point adjacent to the 7th thoracic vertebra (T7). Means ± standard deviation per data point.

