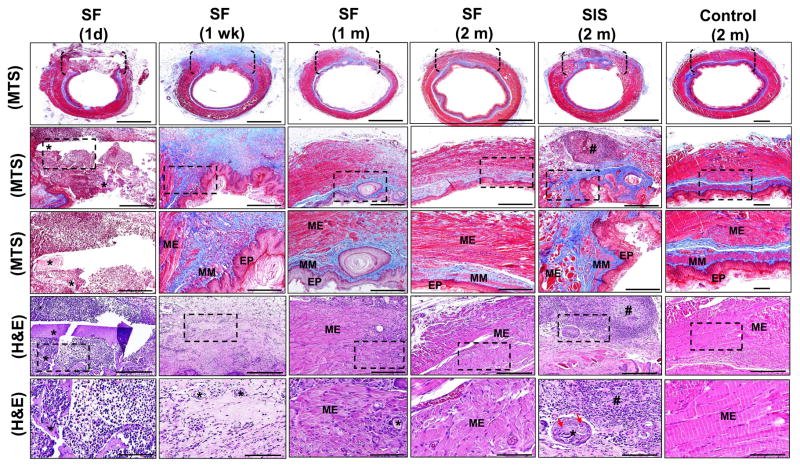
Figure 6. Histological evaluations of tissue regeneration and host responses in sham controls and implant groups.
[1st row] Photomicrographs of MTS-stained gross esophageal cross-sections containing region of tissue repair. Brackets denote sites of scaffold anastomosis or control esophagotomy. Scale bars = 1.25 mm. [2nd row] Magnification of global tissue regeneration area (RA) bracketed in 1st column. Scale bars = 750 μm. [3rd row] Magnified boxed area in 2nd column. Scale bars = 250 μm. [4th row] Photomicrographs of H&E-stained sections from bracketed area described in 1st column. Scale bars = 250 μm. [5th row] Magnified boxed area in 4th row. Scale bars = 80 μm. EP = epithelium; MM = muscularis mucosa; ME = muscularis externa. (*) = scaffold remnants. (#) = aggregate of mononuclear cells indicative of chronic inflammation. Red arrows denote multi-nuclear giant cells encapsulating residual scaffold remnants.

