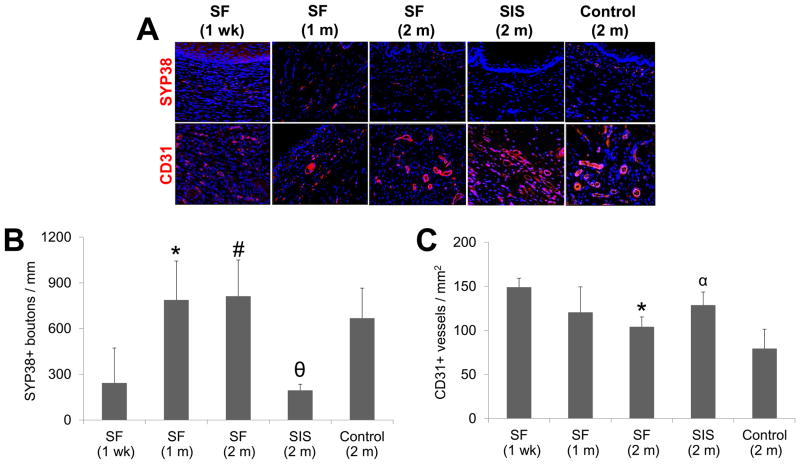
Figure 9. Immunohistochemical and histomorphometric analyses of de novo innervation and vascularization in experimental groups.
[A] Photomicrographs of synaptophysin (SYP38) and CD31 protein expression present within original graft sites or control esophagotomy area. For all panels, respective marker expression is displayed in red (Cy3) labeling. Blue denotes DAPI nuclear counterstain. Arrows denote SYP38+ boutons. Scale bars in all panels = 200 μm. [B, C] Histomorphometric analysis of density of SYP38+ boutons [B] and CD31+ vessels [C] observed at sites of tissue regeneration in implant groups or sham controls. (*) = p<0.05 in comparison to 1 wk SF group. (#) = p<0.05 in comparison to SIS. (θ) = p<0.05 in comparison to sham control. (α) = p<0.05 in comparison to all other 2 m groups.

