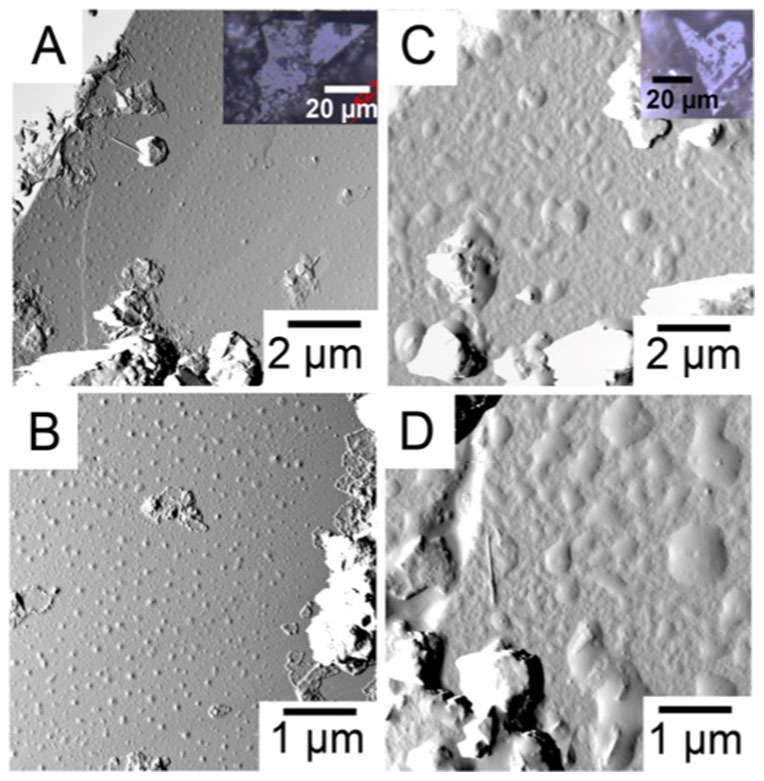
Figure 2. Tapping mode AFM images, showing topography, from A) and B) Sample 1; C) and D) Sample 2.

The contrast results from changes in oscillation amplitude, as the tip gets closer to the surface. This imaging mode enhances feature edges. These surfaces have not been imaged precisely over the same areas as where the force maps were recorded but they are representative for the types of surface morphology that we generally observe on quartz grain surfaces from sandstone. The insets are images from an optical microscope for A) Sample 1 and C) Sample 2.
