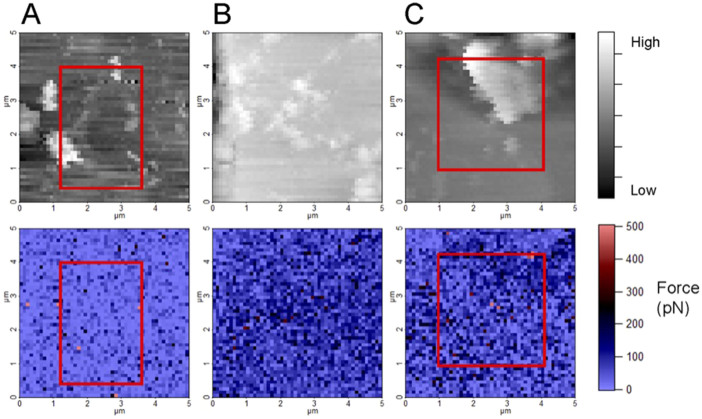
Figure 3. Topography images (upper row) and the corresponding force maps (lower row) for A) Experiment 1 (Sample 1), B) Experiment 2 (Sample 1), C) Experiment 3 (Sample 2).
The red squares in A) and C) outline the areas that were visible in all maps and that were used for determining average adhesion.

