Figure 5.

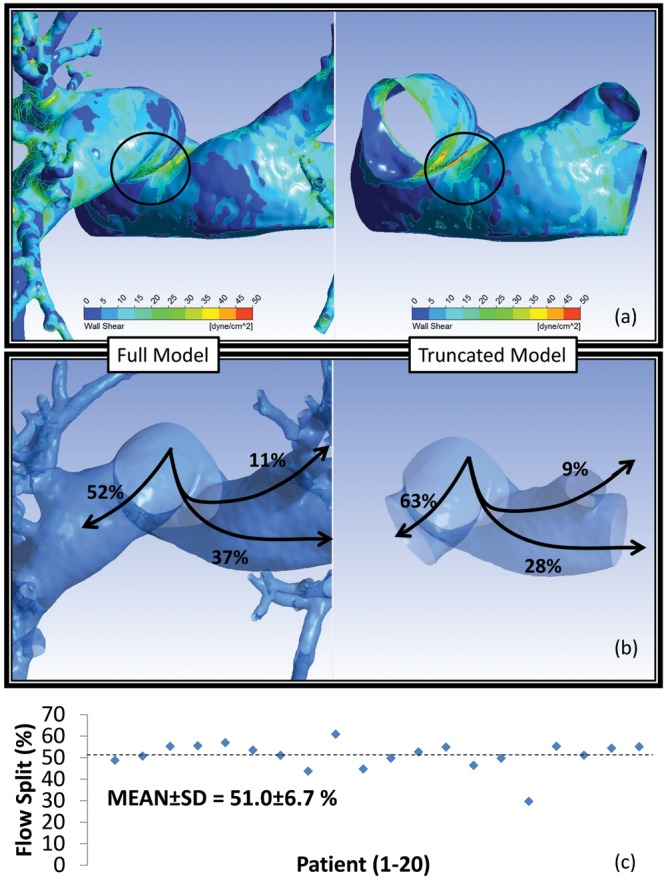
Impact of vascular reconstruction on the computational fluid dynamics solution. a, Wall shear stress (WSS) distribution on the same vasculature reconstructed to the third (right) and seventh (left) generations. Regions of stress concentrations in the proximal vasculature are common between the two models, but with a spatially averaged WSS difference of 14%. b, The full model calculates a more physiological flow split (52% to the right lung and 48% to the left lung), while the truncated model likely overestimates perfusion into the right lung (63% vs. 37% to the left lung). c, All patient-specific models in this study were reconstructed to the limit of image resolution (ca. seventh generation), leading to a 51.0% ± 6.7% (indicated by the horizontal dotted line) flow split between the two lungs. SD: standard deviation.
