
Figure 5. In transgenic mice, PGC-1α levels are maintained during HU.
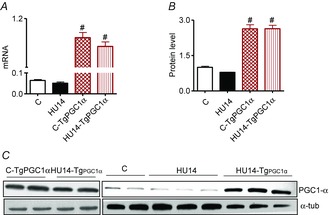
A, quantification of mRNA levels of PGC-1α in WT and transgenic mice. B, quantification of protein levels of PGC-1α by Western blot in WT and transgenic mice. C, representative Western blot of PGC-1α. *Significantly different from C; #significantly different from C and HU-14 at P < 0.05, n = 5 for each group. Data are presented as means ± SEM.