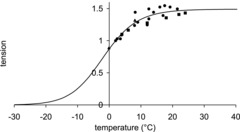
Figure 1. Fitting of experimental data on the temperature dependence of isometric tension with a sigmoid plot.

Experimental data of (▴) Ford et al. (1977), (•) Edman (1979, 1988) and Radzyukevich & Edman (2004) circles, and (▪) Griffiths et al. (2002). Continuous line: best fit to the data using the equation of Coupland et al. (2001) with ΔH = 115 kJ mol−1 and T0.5 = −1.8°C. Tensions are normalised to their value at 2ºC.
