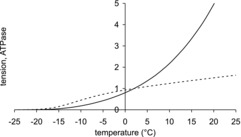
Figure 5. Comparison of temperature dependence of isometric tension and ATPase for the model.

Isometric tension, dotted line; ATPase, continuous line. Both tension and ATPase are normalised to their value at 2°C.

Isometric tension, dotted line; ATPase, continuous line. Both tension and ATPase are normalised to their value at 2°C.