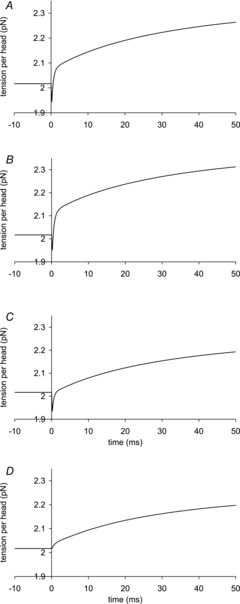
Figure 7. Early time course of tension transients by the model responding to a T-jump.

The T-jumps from 2 to 7°C started at zero time and lasted 0.2 ms. A, unaltered model (α kept at 4 × 10⁻⁵ per °C rise and ΔHtens1 kept at 29.8 kJ mol−1); B, model with α kept at 4 × 10⁻⁵ per °C rise but ΔHtens1 raised to 50 kJ mol−1; C, model with α kept at 4 × 10⁻⁵ per °C rise but ΔHtens1 lowered to 0 kJ mol−1; D, for the model with α, ΔHtens1 and  all lowered to zero.
