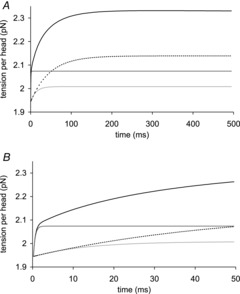
Figure 8. Fitting with three exponential functions of the time course of the tension transient by the model after the end of a T-jump.

A, long time course over 500 ms; B, early time course over 50 ms. The T-jump from 2 to 7°C started at zero time and lasted 0.2 ms. The tension is shown only after the end of this T-jump. Model tension, black line; phase 1 tension, dark grey line; phase 2 tension, light grey line; phase 3 tension, dotted line. The fitted line with three exponentials coincides with the model tension at this resolution.
