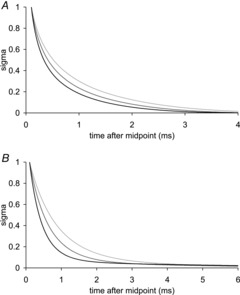
Figure 10. Time courses of sigma for model after rapid length steps.

A, after a 4.5 nm hs−1 release; B, after a 1.5 nm hs−1 stretch at three temperatures: −0.1°C (light grey), 3.7°C (mid grey) and 8.1°C (black).

A, after a 4.5 nm hs−1 release; B, after a 1.5 nm hs−1 stretch at three temperatures: −0.1°C (light grey), 3.7°C (mid grey) and 8.1°C (black).