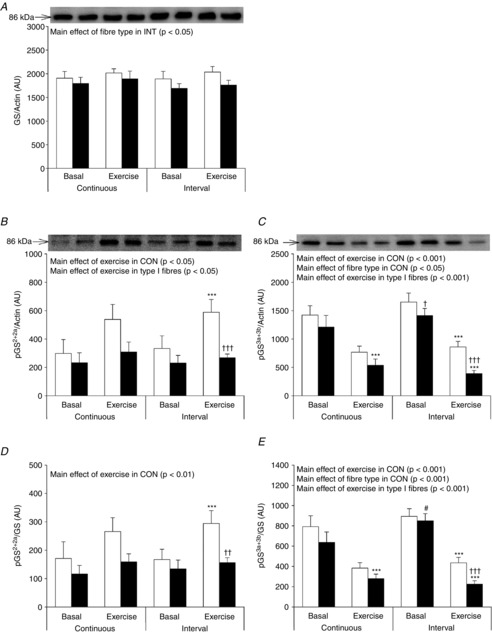
Figure 6. Glycogen synthase in type I and type II muscle fibre pools before and after CON and INT.

Muscle fibre type-specific protein expression of GS (A) and phosphorylation of GS2+2a (B) and 3a+3b (C) were evaluated by Western blotting. Quantified values are expressed relative to actin content. Open bars represent type I fibres and filled bars represent type II fibres. Representative blots are shown above bars for each protein loaded in the same order as the graphs below. Data are expressed as means ± SEM. AU, arbitrary units. ***P < 0.001 vs. basal conditions, †P < 0.05 vs. type I muscle fibres, ††P < 0.01 vs. type I muscle fibres, †††P < 0.001 vs. type I muscle fibres, #P < 0.05 vs. CON.
