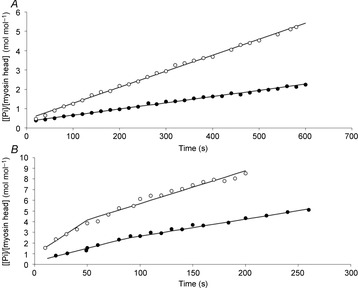
Figure 3. Time courses of SOL myosin ATPase in relaxed (A) or Ca2+-activated (B) myofibrils in control group (filled circles), and after 21 days of clenbuterol treatment (open circles).

Reaction mixtures were 3 μm myofibrils (as myosin heads) plus 30 μm [γ-32P]ATP at 4°C. The reaction mixtures were quenched at the times indicated and the total [32P]Pi concentrations were determined. In the relaxed condition, the amplitude of Pi burst and ATPase activity were 0.34 ± 0.05 vs. 0.45 ± 0.07 mol mol−1, and 0.0032 ± 0.0005 vs. 0.0083 ± 0.0011 s−1 for the control and 21-day clenbuterol-treated groups, respectively. In the Ca2+-activated condition, the slope of the fast linear phase (ATPase activity in unloaded shortening), slope of the slow linear phase, duration of the unloaded shortening phase (dashed lines) and the ATP cost of shortening were 0.025 ± 0.004 vs. 0.065 ± 0.01 s−1, 0.016 ± 0.003 vs. 0.031 ± 0.006 s−1, 87 ± 9 vs. 50 ± 5 s and 2.4 ± 0.2 vs. 4.2 ± 0.4 mol mol−1 for the control (CTL-G21) and 21-day clenbuterol-treated groups (CB-G21), respectively.
