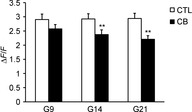
Figure 6. Effect of clenbuterol treatment on FDB Ca2+ transient amplitude.

Bar graphs comparing amplitude for single-fibre AP-elicited Ca2+ transients in FDB fibres of control (CTL; n = 7) or clenbuterol-treated (CB; n = 8) rats after 9, 14 and 21 days of treatment. Amplitude was calculated from individual exponential fits and averaged. **P < 0.01.
