
Figure 2.
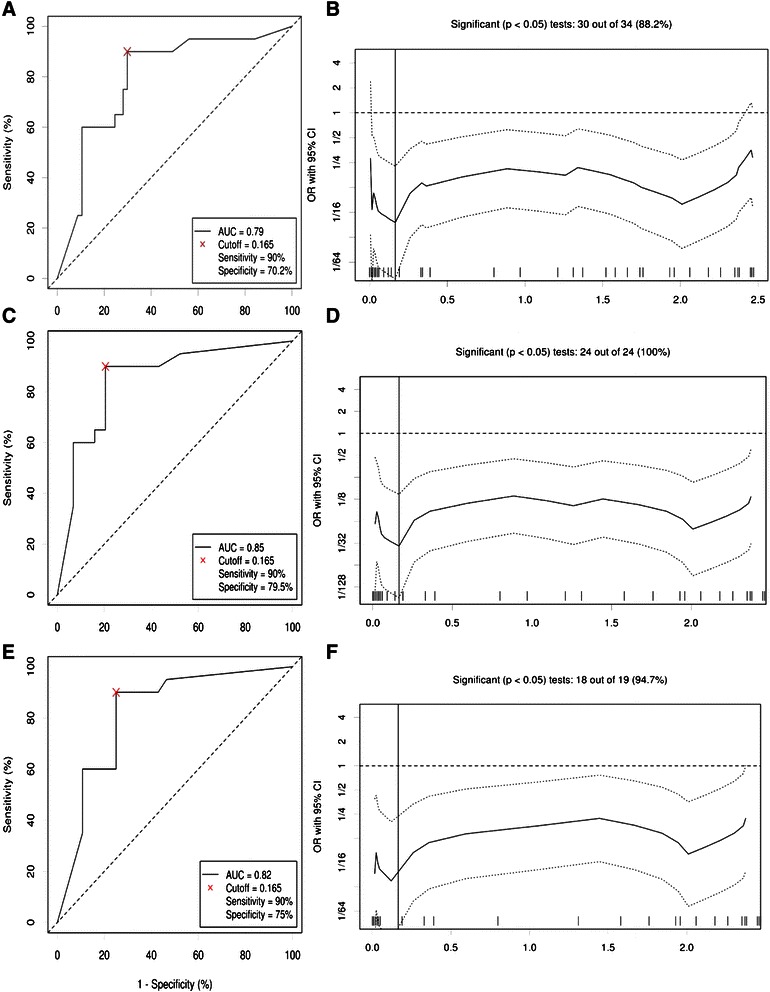
The role of blood miR-200c in breast cancer diagnosis. Receiver-operating characteristic (ROC) curve analysis (A) and odds ratio plot (B) using blood miR-200c expression levels for discriminating breast cancer patients (n = 57) and healthy controls (n = 20). ROC curves and odds ratio plots for discrimination of stage I-III BC from healthy controls (Cand D) and discrimination of stage I-II patients from healthy controls (E and F) are also shown.