Figure 1.

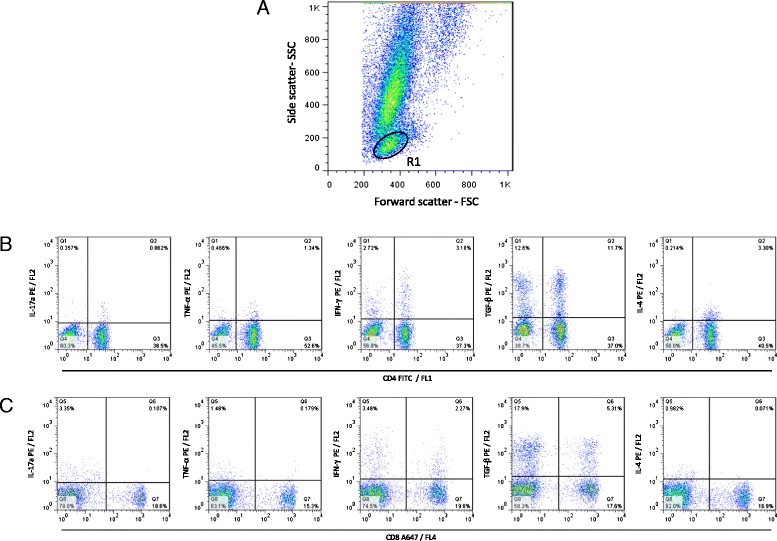
Representative dot plots illustrating the analysis of intracellular cytokine profile in T-cell subsets. (A) Pseudocolor plot distribution of short-term in vitro cultured (control or SLA-Ag stimulated) canine whole blood sample according to cell size (Forward scatter - FSC) and granularity (Side scatter- SSC) used for lymphocyte gate selection (R1) of FSCLowSSCLow events. (B) Pseudocolor plots representing cytokines + (IL-17, TNF-α, IFN-γ, TGF-β and IL-4) CD4+ cells within gated lymphocytes and (C) Pseudocolor plots representing cytokines + (IL-17, TNF-α, IFN-γ, TGF-β and IL-4) CD8+ cells within gated lymphocytes. The frequency of cytokines+ T-cells subsets were calculated by quadrant statistics approach and first reported as percentage of gated lymphocytes prior to the calculation of the SLAg/Control indexes.
