Figure 5.

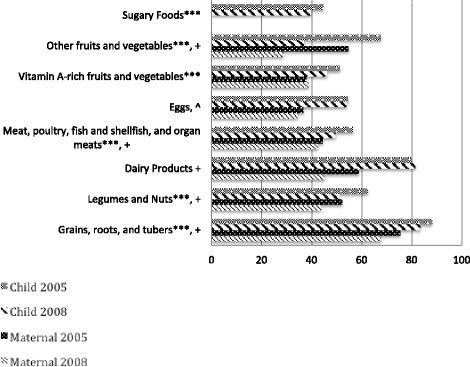
Food Group Consumption, by Child and Mother, Upper Egypt, 2005 and 2008. *P <0 .05 (Child); ***P < 0.001 (Child); ^ P < 0.05 (Mother}; + P < 0.001 (Mother).

Food Group Consumption, by Child and Mother, Upper Egypt, 2005 and 2008. *P <0 .05 (Child); ***P < 0.001 (Child); ^ P < 0.05 (Mother}; + P < 0.001 (Mother).