
Figure 4.
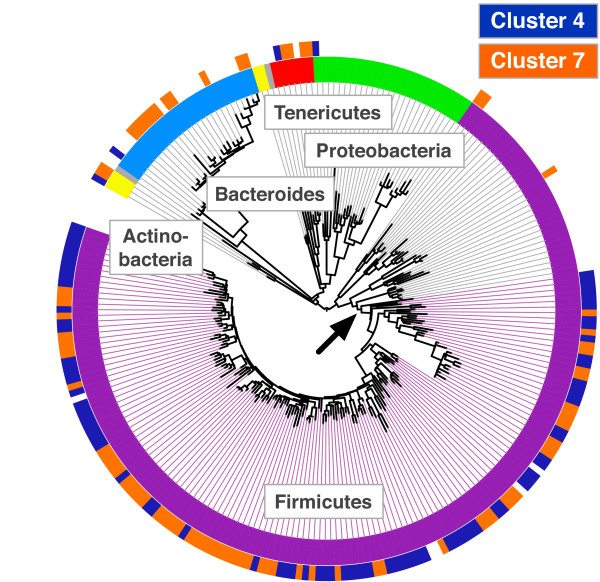
Phylogenetic evidence for competing gut bacterial taxa. OTUs clustered by their dynamics across Subject B’s enteric infection (Figure 3) were plotted on a reference phylogeny built using 16S rRNA sequences (Methods). Taxonomic assignments for each OTU are shown on the inner ring and correspond with the color coding from Figure 1. Taxa associated with increasing (Cluster 7, orange) or decreasing (Cluster 4, blue) abundance after infection are indicated on the outer ring. A monophyletic subtree within the Firmicutes (arrowed and shaded) is significantly associated with taxa from the two clusters (P <0.001, Fisher’s Exact Test).