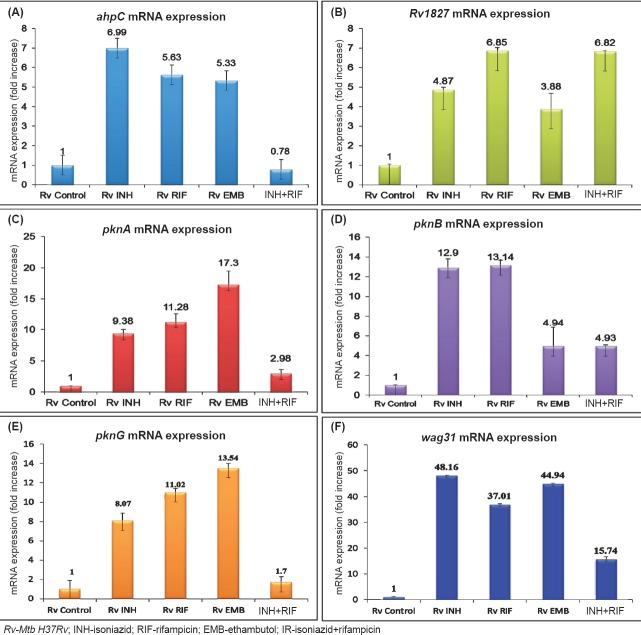
Fig. 4.
Detection of mRNA expression in drug treated Mtb isolates. Isolates treated with isoniazid (INH, 0.1μg/ml), rifampicin (RIF, 1.0μg/ml), ethambutol (EMB, 5μg/ml) and INH (0.1μg/ml) +RIF (1.0μg/ml). The expression is represented in fold increase. The 16sRNA was used as internal control for mRNA expression analysis. mRNA expression of (A) ahpC, (B) Rv1827, (C) pknA, (D) pknB, (E) pknG and (F) wag31. Calculation and statistical analysis carried out by using the 2-∆∆CT method and results presented in fold increase.

