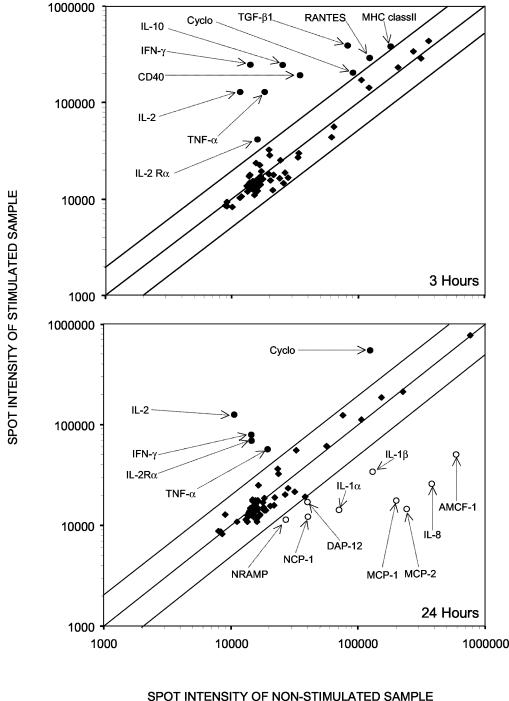
FIG. 2.
Scatterplot showing the differential levels of expression of the genes between unstimulated and PMA-Iono-stimulated porcine PBMCs cultured in vitro for 3 and 24 h. Labeled cDNA probes were prepared from lymphocytes of the same animal stimulated or not stimulated with PMA-Iono for 3 or 24 h. Genes that were overexpressed are indicated by filled circles, those that were expressed normally are indicated by filled diamonds, and those that were underexpressed are indicated by open circles. Abbreviations can be found in the gene product description column of Table 1.

