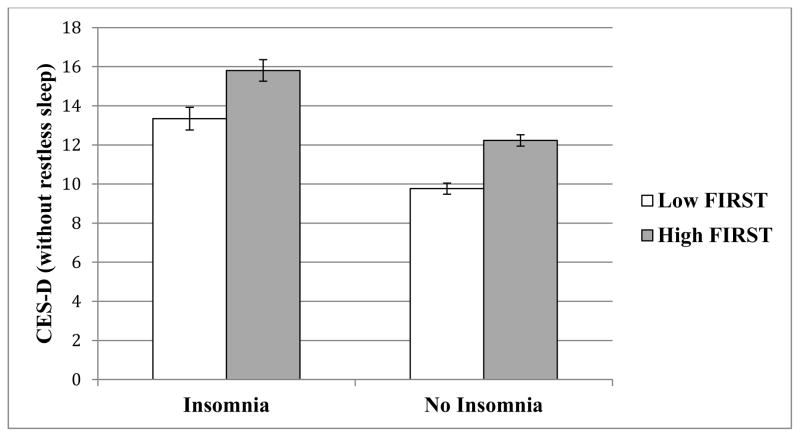
Figure 1.
Mean depressive symptoms for insomnia and no insomnia groups represented as a function of FIRST scores. High (Mean = 24.1; SD = 3.4) and Low FIRST (Mean = 15.1; SD = 2.8) determined via median split for graphical representation only. FIRST scores range from 9 – 36. All reported group differences are significant at p < .001.

