Figure 3.
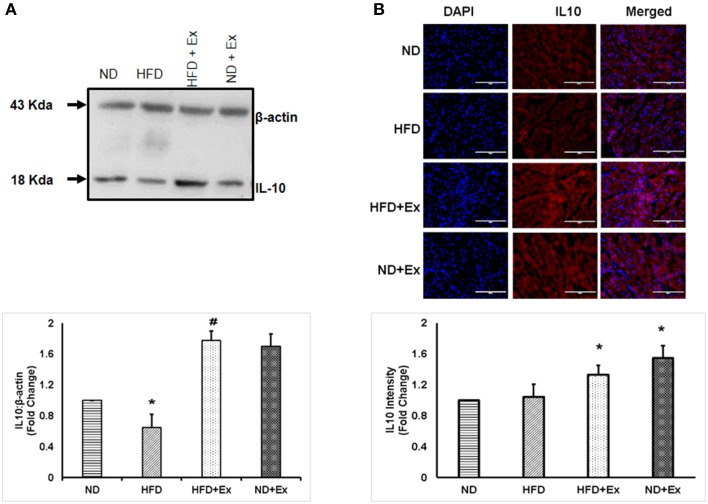
(A) Expression of IL-10 protein levels in different groups of animals. β - actin was used as a loading control. Bar diagram shows fold change (N = 4) in IL-10 expression relative to normal diet. (B) Microscopic images of tissue sections of different groups stained with rabbit anti-IL-10 antibody and anti-rabbit alexa flour 594. Bar diagram shows fold changes in IL-10 expression relative to normal diet. Values are represented as a mean ± SE (N = 4–5). *P < 0.05 compared to ND; #P < 0.05 compared HFD.

