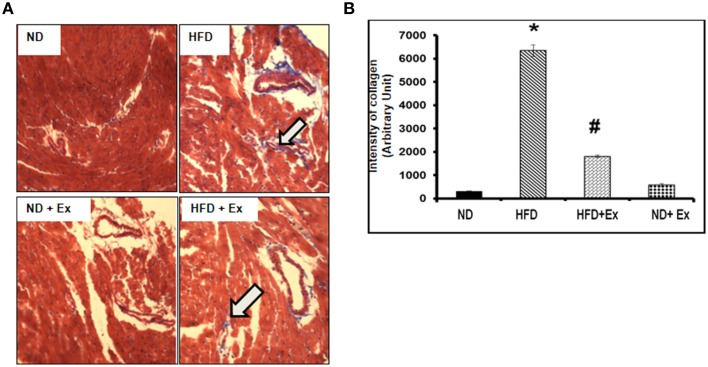
Figure 4.
(A) Masson Trichrome staining assessing fibrosis in heart sections of each group. Arrows denote examples of fibrosis (blue stain). (B) Bar diagrams represent the quantification of fibrotic collagen (blue) content of image. Data represents mean ± SE (N = 4). *P < 0.05 compared to ND, and #P < 0.05 compared to HFD.

