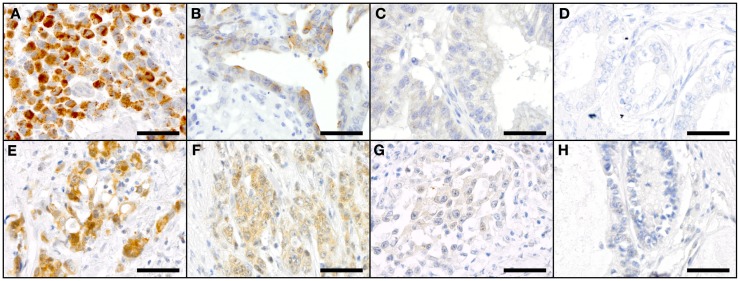
Figure 2.
Staining patterns for NOTCH1 (A–D) and NOTCH2 (E–H) in primary resected GC specimen. NOTCH1: (A) high-intensity cytoplasmic staining (SI 12), (B) medium-intensity cytoplasmic staining (SI 4), (C) low-intensity cytoplasmic staining (SI 2), and (D) negative cytoplasmic staining for NOTCH1 (SI 0); NOTCH2: (E) high-intensity cytoplasmic staining (SI 9) and low-intensity nuclear staining (SI 1), (F) medium-intensity cytoplasmic staining (SI 6) and low-intensity nuclear staining (SI 1); (G) low-intensity cytoplasmic staining (SI 3) and negative nuclear staining (SI 0); and (H) negative cytoplasmic and nuclear staining for NOTCH2. Scale bars: 50 μm.

