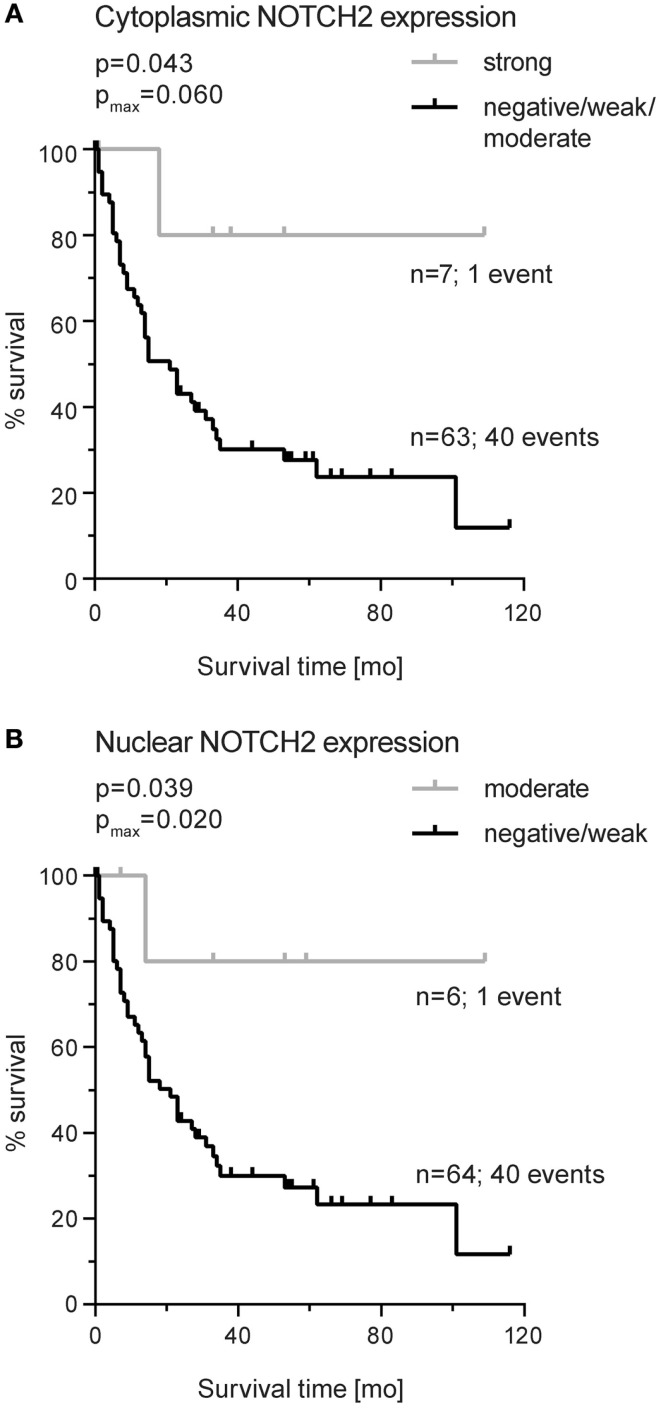
Figure 5.
Kaplan–Meier survival curves for NOTCH2 protein expression in primary resected gastric carcinomas of the intestinal type. (A) Cytoplasmic expression (median OS: not reached versus 21.2 months; 95% CI 11.4–31.3) and (B) nuclear expression (median OS: not reached versus 21.4 months; 95% CI 11.6–31.1). p-Values were determined by log-rank statistics; pmax corresponds to p-value for maximally selected statistics.

