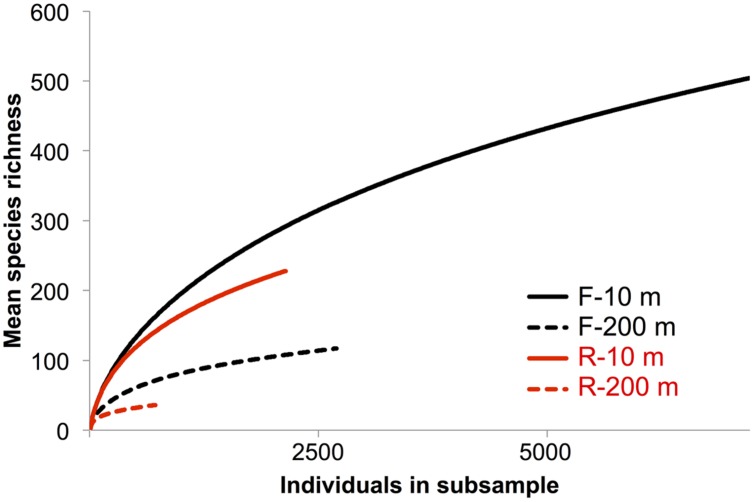
FIGURE 4.
Rarefaction species richness curves. Rarefaction curve analysis to infer the number of observed virus phylotypes present within each gene-specific primer bin. Each curve denotes the number of observed OTUs as a function of the number of sampled reads. Reads were clustered into OTUs based on a 95% similarity threshold.

