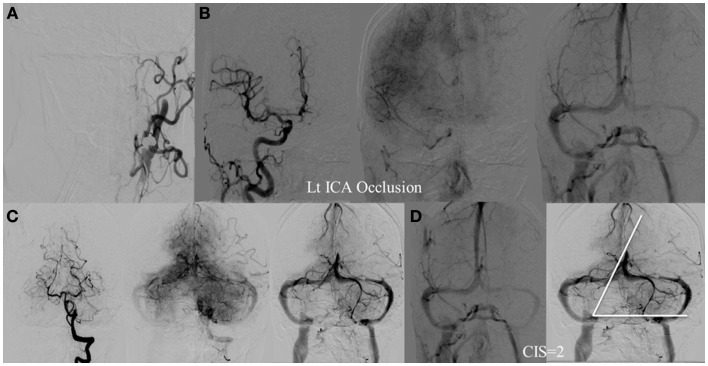
Figure 6.
CIS = 2. (A) Occlusion of the left ICA. (B) Injection of the right ICA demonstrates filling of the left ACA territory through the Acom with partial opacification of the fronto–parietal lobes via pial collaterals. (C) Injection of the left vertebral artery demonstrates partial opacification of the left temporal lobes via pial collaterals. (D) Delayed venous phase of the right ICA and left vertebral showing approximately two-third of the ischemic territory (left middle MCA) to demonstrate capillary blush.

