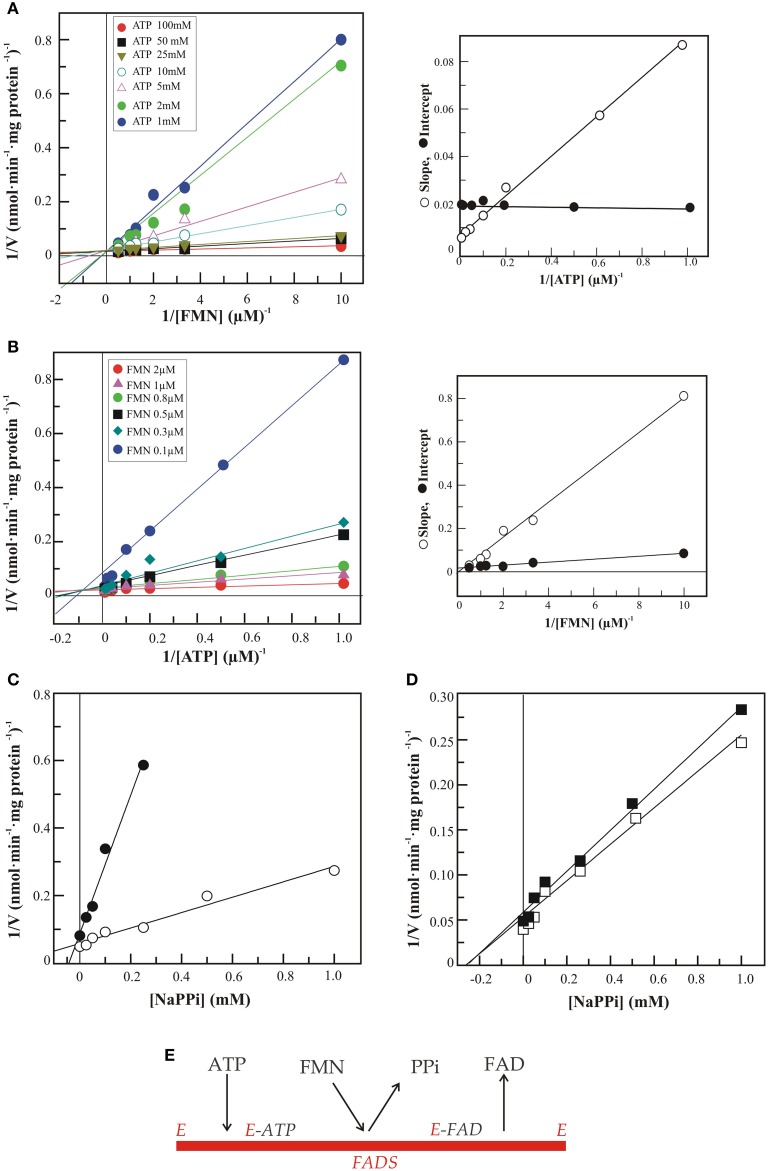
Figure 3.
Steady state kinetic analysis of FAD synthesis catalyzed by hFADS2. FAD synthesis rate, catalyzed by 6His-hFADS2 (2 μg, 35.4 pmoli), was measured by the initial rate of fluorescence decrease (λex at 450 nm, λem at 520 nm) at 37°C in 50 mM Tris-HCl, pH 7.5 in the presence of 5 mM MgCl2 and FMN and ATP at the reported concentrations. Where indicated, sodium pyrophosphate was added at the indicated concentrations. In (A) the initial rates represented by the Lineweaver–Burk plot of 1/ν vs. 1/[FMN] at fixed ATP concentrations. In the inset the slope and intercepts of the Linaeawever-Burk plot (with FMN as variable substrate) vs. 1/[ATP]. In (B) the initial rates represented by the Lineweaver–Burk plot of 1/ν vs. 1/[ATP] at fixed FMN concentrations. In the inset the slope and intercepts of the Linaeawever-Burk plot (with ATP as variable substrate) vs. 1/[FMN]. In (C) the Dixon plot of the inhibition by pyrophosphate at ATP 10 μM and FMN 0.3 μM (•) or 2 μM (◦). In (D) the Dixon plot of the inhibition by pyrophosphate at FMN 2 μM and ATP 10 μM (◼) or 50 μM (◻). In (E) the sequential ordered bi-bi mechanism for 6-His-hFADS2 is represented.

