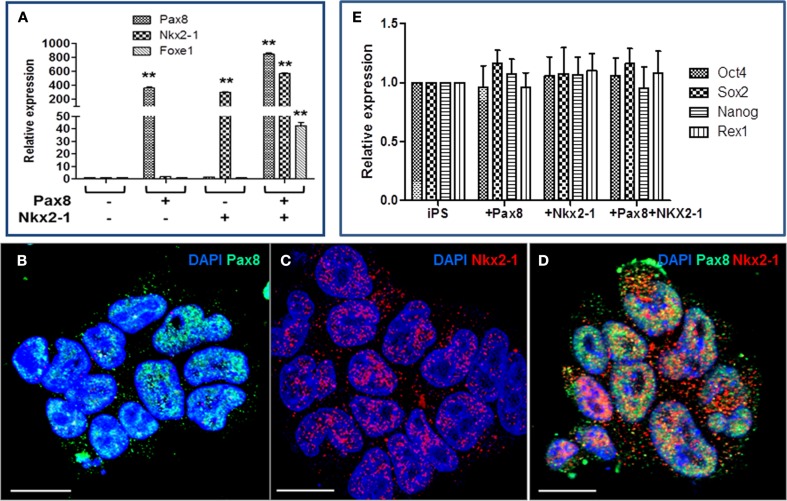
Figure 2.
Characterization of PAX8, NKX2-1, and Pax8+NKx2-1+ mouse iPS cell lines. (A) RT-PCR analysis of selected iPS cell lines for thyroid transcription factors. The figure shows PAX8, NKX2-1, and FOXE1 transcription after culture in selection medium for up to 4 weeks. Data presented (mean) are from three independent experiments in which all sample sets were analyzed in triplicate. **p < 0.01 compared to untransfected iPS cells. (B–D) Immunofluorescence analysis of PAX8 and NKX2-1 in the transfected cell lines. Scale = 100 μm. (E) Retention of stemness in transfected cell lines is shown by the continued expression of Oct4, Sox2, Nanog, and Rex1 gene expression.

