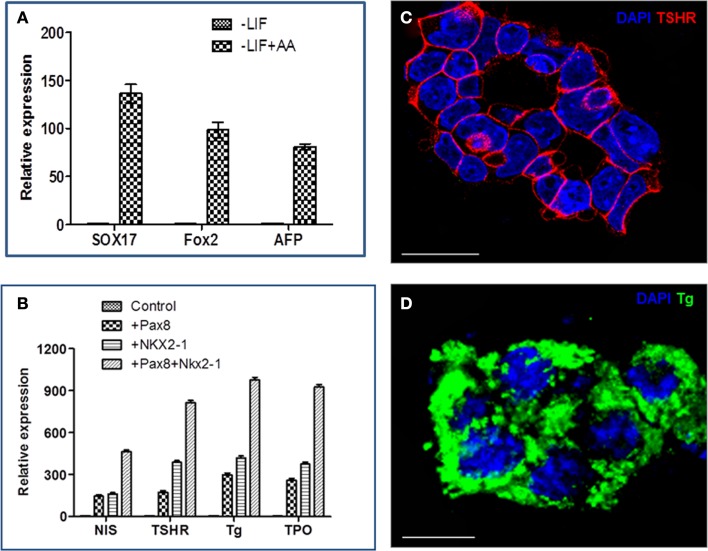
Figure 3.
The differentiation of iPS cells into thyroid cells. (A) Representative RT-PCR analysis for the expression of endoderm markers, Sox17, Fox2, and AFP, in Activin A (AA) treated and untreated cells. Data were expressed as mean ± SEM and represent one of three separate experiments. (B) Thyroid-specific genes (Tg, TPO, TSHR, and NIS) in individual cell lines after differentiation with Activin A and TSH. Data were expressed as mean ± SEM and represent one of three separate experiments. The difference between control ES cells, Pax8+, Nkx2-1+ and double positive cells was highly significant (p < 0.01) for each of the mRNA examined. (C,D) Immunostaining of thyroid neofillicles derived from double transfected PAX8+NKX2-1+ iPS cells after differentiation with Activin A and TSH and showing TSHR expression (red) on the cell surface (C) and Tg expression (green) in the follicle lumen and cytoplasm (D). Scale bar = 100 μm.

