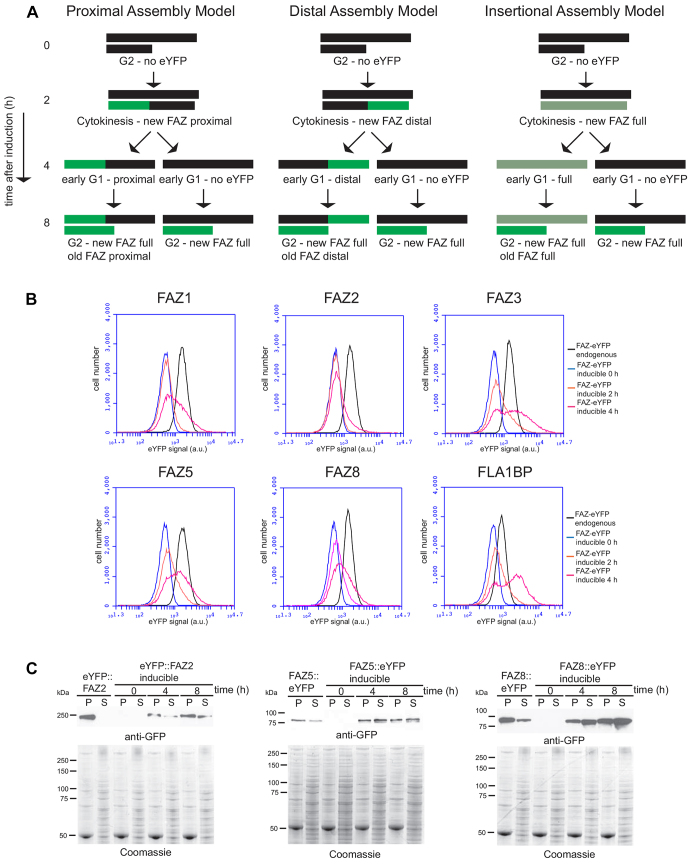
Fig. 3.
Models of addition of new FAZ proteins and expression of FAZ–eYFP over the time course.(A) The cartoons show the pattern of FAZ labelling a G2 cell would produce at each time-point during an induction given the different addition models. A black line represents the FAZ before doxycycline induction; two parallel black lines indicate that the assembly of a new FAZ has begun. A green line represents the addition of FAZ–eYFP proteins to the assembling FAZ after induction. The proximal assembly model shows the position of proximally added FAZ–eYFP proteins during the time course. The distal assembly model shows the position of distally added FAZ–eYFP proteins during the time course. The insertional assembly model shows the position of randomly added FAZ–eYFP proteins during the time course. (B) Expression of FAZ–eYFP proteins measured by flow cytometry for all the endogenously tagged and inducible cell lines (0, 2 and 4 hours post induction). (C) Western blot detecting FAZ–eYFP proteins (FAZ2, FAZ5 and FAZ8) from endogenous tagged and inducible cell lines (0, 4, 8 hours post induction) after detergent fractionation of the cells into pellet (P) and supernatant (S) fractions using anti-GFP antibody. A Coomassie-stained gel acts as a loading control and confirms successful fractionation; 4×10⁶ cell equivalents were loaded per lane.

