
Fig 2.
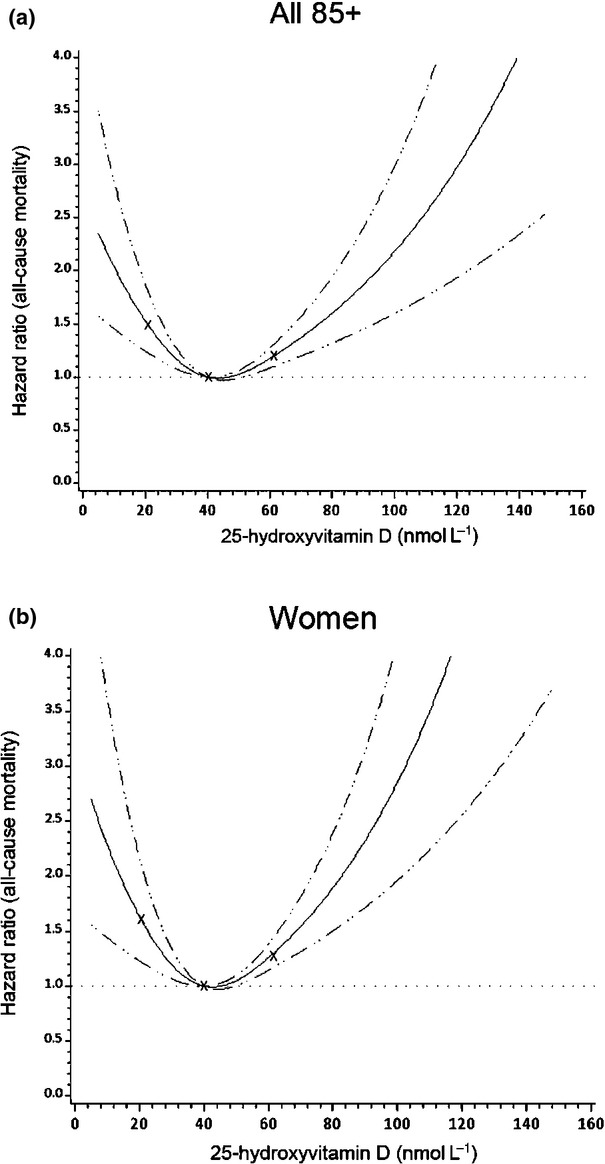
Restricted cubic spline curves of dose–response relationship between serum 25-hydroxyvitamin D [25(OH)D] and all-cause mortality in the Newcastle 85+ Study. A non-linear dose–response relation was observed in the entire cohort (a) and in women (b) using restricted cubic splines with three knots fitted at percentiles (at approximately 20, 40 and 60 nmol L−1) (test for non-linear relation, P < 0.001).