Figure 5.
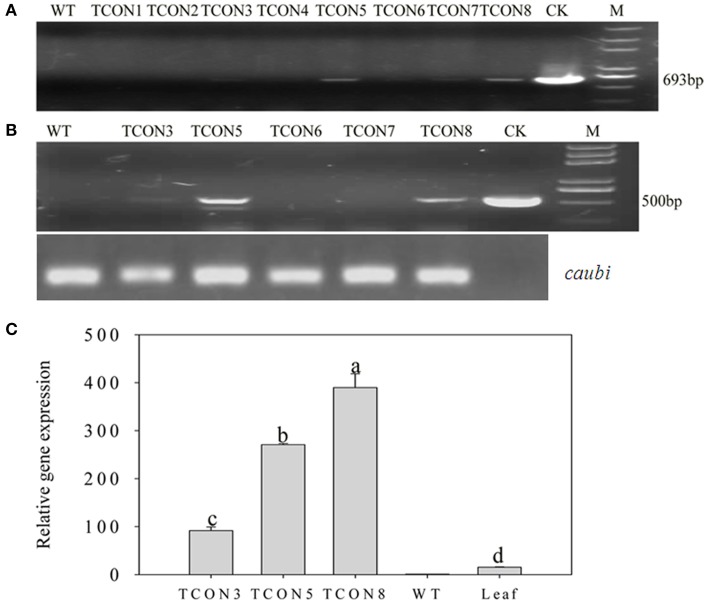
Molecular analysis of T0 transgenic plants. (A) PCR confirmation of TCON transgenic pepper plants using BamHI coxIVF and SacI orf507R primers that would amplify 693 bp fragment of the cassette in DNA level.(B) RT-PCR analysis of buds from TCON transgenic plants with Kpn I orf507F and SacI orf507R primers that would amplify 507 bp fragment with caubi gene as reference gene. (C) qRT-PCR analysis of buds from TCON transgenic plants. TCON1~8, transgenic TCON plants; WT, transformed control plant; CK, positive control (amplified from plasmid DNA); Leaf, leaves collected from the three transformants; M, Trans2K plus marker. Statistically significant differences between the means were determined using Fisher's LSD test (p < 0.05).

