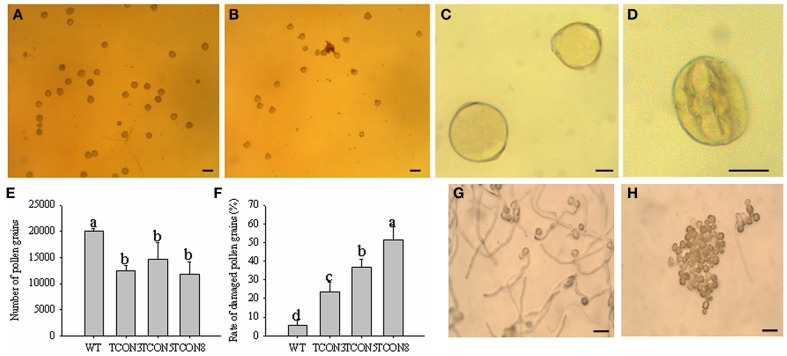
Figure 7.
Cytological analysis of the pollen grains in T0 transgenic plants. (A,C) Pollen grains of WT. (B,D) Pollen grains of T0 transgenic plants. (E) Number of pollen grains in each anther. (F) Rate of damaged pollen grains. (G) Pollen germination of WT. (H) Pollen germination of T0 transgenic plants. (A,B) Bars = 100 μm; (C,D) Bars = 25 μm; (G,H) Bars = 200 μm.

