Figure 2.

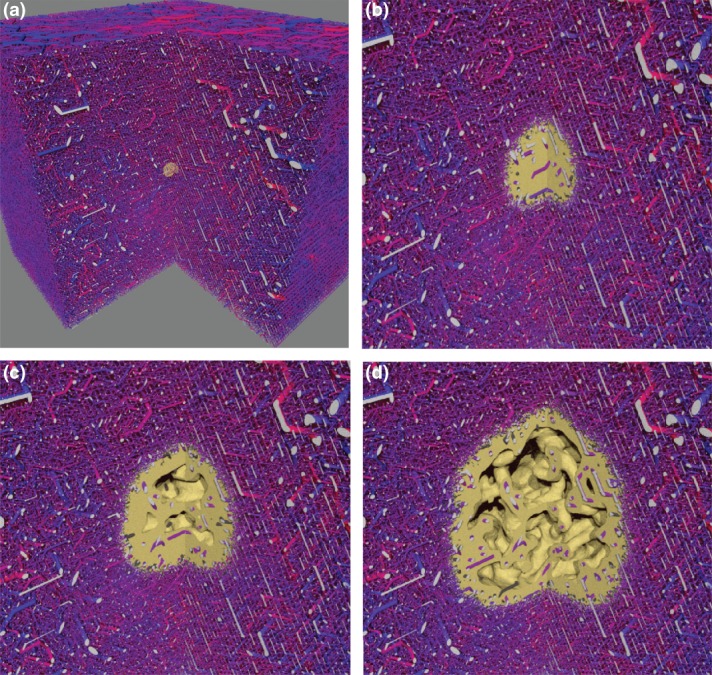
Tumor vascular network remodeling, based on simulations of the model described in Ref 54: An initial vascular network was synthetically generated. Then a simulation of tumor growth was performed using this network. The network edges are visualized as cylinders, color coded according to their associated blood pressure value. The viable tumor tissue is visualized as yellow mass. Hollow interior regions appear due to necrotic tissue which was once viable but has died from oxygen deprivation. The simulated area is a box of ca. 8 mm lateral size of which a quarter is cut away for display purposes. The cutting faces of vessels are colored light grey. (a) The initial state with a small tumor nucleus. (b) 200 h later angiogenesis has set in. Many tumor vessels have collapsed due to reduced blood flow. Surviving interior vessels are dilated due to switching from angiogenesis to circumferential growth. (c) After 400 h, the tumor network is thinned out sufficiently that tumor regions are located well outside the diffusion distance of oxygen, causing hypoxia and subsequent necrosis. (d) As the tumor continues to grow it pushes the region of angiogenic activity further into normal tissue and leaves a sparse network behind its rim. This state, as seen after 800 h simulated time, shows typical features of tumor vasculature: compartmentalization, highly vascularized rim, decreasing vascular density toward the center where the network is very sparse, vessel dilation, loss of hierarchical organization. The model parameter selection for this case was guided by experimental data for human melanoma.
