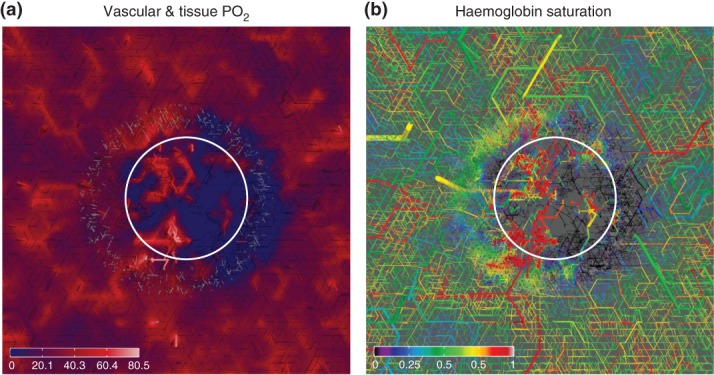
Figure 3.

Tumor oxygen distribution, based on simulations of the model described in Ref 54, with a vascular network and tumor growth module as in Figure 2, augmented by an oxygen concentration field computation as outlined in Section Oxygen Concentration: The distribution of intravascular and tissue oxygen was computed for an artificially generated vascular network. Tumor vascular remodeling was simulated, where the tumor size increases from a small nucleus to ca. 4 mm diamter, which is about half of the lateral size of the simulation box. Parameter settings were guided by experimental data from breast tumors. The result is a typical chaotic compartmentalized tumor network which is connected to an arterio-venously structured vasculature of the host. This configuration was taken as input for a detailed computation of oxygen. Respective model couples advective oxygen transport by the blood stream via transvascular fluxes with diffusion within the tissue domain and seeks a self consistent solution. Advection in each vascular segment is approximated as one dimensional problem, neglecting radial concentration and velocity variations. These images depict slices through the simulation domain where the location of the tumor is indicated roughly by the circle. (a) depicts the vascular and tissue oxygen partial pressure (PO2). Vessels are shown as cylinders, but everything outside a central slab of 300 µm thickness has been cut away. The remaining vessels protrude up from the cutting plane showing the tissue oxygen distribution. (b) The vascular oxygen saturation where the slab thickness has been increased to 600 µm.
