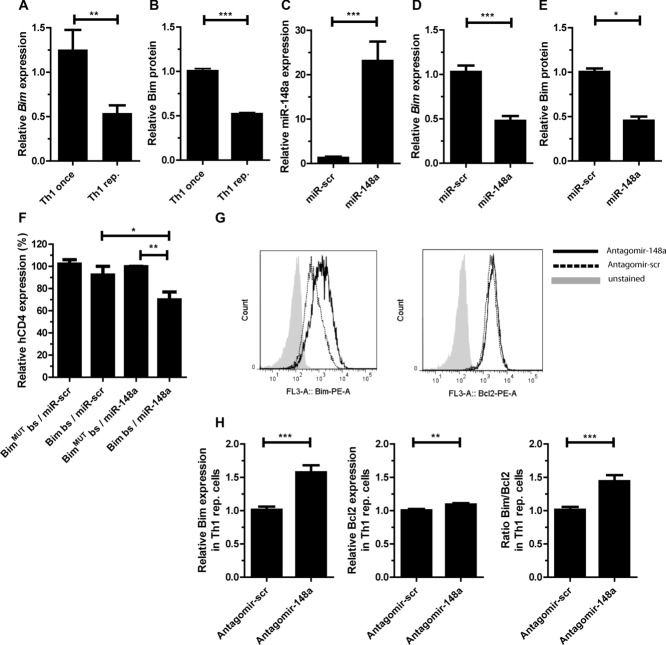
Figure 2.
miR-148a targets Bim in repeatedly activated Th1 cells. (A) Bim mRNA expression in once and repeatedly activated Th1 cells was assessed by qRT-PCR, normalized to HPRT and presented relative to values obtained with once-activated Th1 cells. Data are shown as mean ± SEM, n = 1, each pooled from four independent experiments. (B) Bim protein expression in once and repeatedly activated Th1 cells assessed by intracellular protein staining and flow cytometry, presented as MFI of Bim, relative to once-activated Th1 cells. Data are shown as mean ± SEM, n = 1, each pooled from three independent experiments. For gating strategies see Supporting Information Fig. 7B. (C and D) Overexpression of miR-148a and a scrambled control (miR-scr) in CD4+ T cells assessed by qRT-PCR, analyzed on day 5 postactivation. miR-148a and Bim expression was normalized to snU6 or HPRT and presented relative to values obtained with miR-scr. Data are shown as mean ± SEM, n = 1, each pooled from six (miR148a) or three (Bim) independent experiments. (E) Bim expression was validated by immunoblotting and represented relative to values obtained with miR-scr. Data are shown as mean ± SEM, n = 1, each pooled from two (miR-scr) or three (miR-148a) independent experiments. (F) Reporter gene expression in activated Th1 cells cotransduced with Bim3′-utr reporter vector containing miR-148a bs (Bim bs) or mutated bs for the miR-148a (BimMUTbs) and an overexpression vector for miR-148a (miR-148a) or a scrambled overexpression vector (miR-scr), assessed by flow cytometry of the MFI of human CD4 on day 5 after activation and presented relative to values obtained for BimMUTbs/miR-148a. Data are shown as mean ± SEM, n = 1, each pooled from four independent experiments. For gating strategies see Supporting Information Fig. 7C. (G) Representative intracellular protein staining of Bim and Bcl2 in repeatedly activated Th1 cells after treatment with antagomir-148a or scrambled control (antagomir-scr) on day 3 postrestimulation with αCD3/αCD28, assessed by flow cytometry. Data shown are from one experiment representative of two independent experiments. For gating strategies see Supporting Information Fig. 7B. (H) Statistical evaluation of MFIs of Bim, Bcl2, and the ratio Bim/Bcl2 after treatment with antagomir-148a presented relative to values obtained with antagomir-scr. Data are shown as mean ± SEM, n = 5 pooled from two independent experiments. (A–F and H) Mann–Whitney test for unpaired data, *p ≤ 0.05, **p ≤ 0.005, ***p ≤ 0.001.

