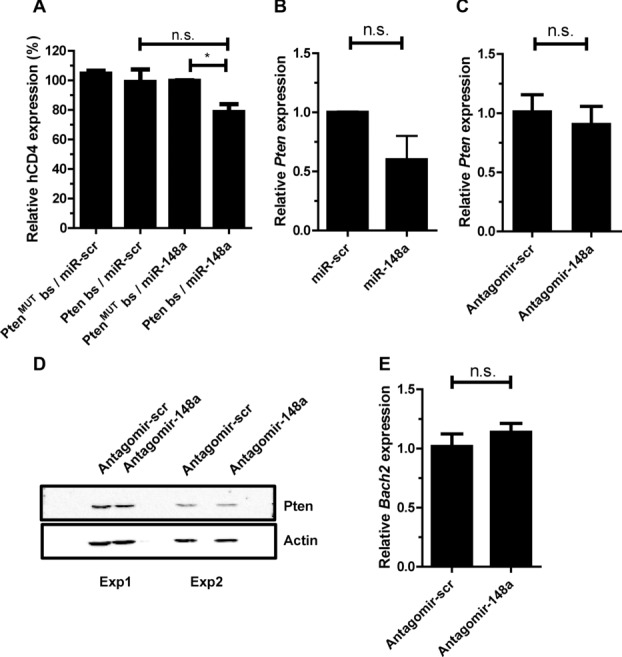
Figure 3.

Mir-148a does no target Pten in repeatedly activated Th1 cells. (A) Reporter gene expression in activated Th1 cells cotransduced with Pten3′-uTR reporter vector containing miR-148a bs (Pten bs) or mutated bs for the miR-148a (PtenMUTbs) and an overexpression vector for miR-148a (miR-148a) or a scrambled overexpression vector (miR-scr), assessed by flow cytometry. MFI of human CD4 on day 5 after activation are presented relative to values obtained for PtenMUTbs/miR-148a. Data are shown as mean ± SEM, n = 4, pooled from two independent experiments. Mann–Whitney test for unpaired data, one-tailed, *p ≤ 0.05, n.s. p = 0.125. For gating strategies see Supporting Information Fig. 7C. (B) Overexpression of miR-148a and miR-scr in CD4+ T cells, analyzed on day 5 postactivation. Pten expression was normalized to HPRT and are presented relative to values obtained with miR-scr. Data are shown as mean ± SEM, n = 1 each pooled from three independent experiments. Mann–Whitney test for unpaired data, n.s. p = 0.125. (C) Pten expression of repeatedly activated Th1 cells after antagomir treatment with antagomir-148a or antagomir-scr on day 3 post restimulation with αCD3/αCD28, normalized to HPRT and presented relative to values obtained with antagomir-scr. Data are shown as mean ± SEM, n = 1, each pooled from three independent experiments. (D) Pten expression in repeatedly activated Th1 cells after treatment with antagomir-148a or antagomir-scr on day 3 postrestimulation with αCD3/αCD28 validated by immunoblotting data from two independent experiments are shown. (E) Bach2 expression in repeatedly activated Th1 cells after antagomir treatment, assessed by qRT-PCR, normalized to HPRT and presented relative to values obtained for antagomir-scr. Data are shown as mean ± SEM, n = 3, from one experiment representative of two independent experiments. Mann–Whitney test for unpaired data, one-tailed.
