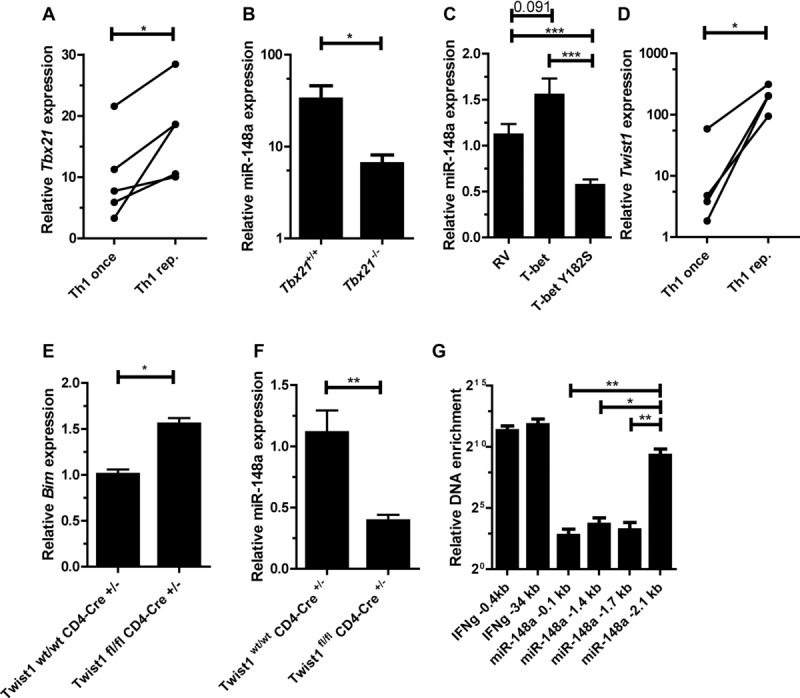
Figure 5.

Expression of miR-148a in Th1 cells is induced by T-bet and Twist1. (A) Tbx21 expression in once and repeatedly activated Th1 cells was assessed by qRT-PCR, normalized to HPRT and presented relative to values obtained for naive Th cells. Each data point represents an individual experiment performed with n = 1. Wilcoxon-test for paired data, *p ≤ 0.05. (B) miR-148a expression in Tbx21−/− Th1 cells and wt control (Tbx21+/+) 48 h after activation, assessed by qRT-PCR, normalized to snU6 and presented relative to values obtained in naive Tbx21+/+ or Tbx21−/− Th cells. Data are shown as mean ± SEM, n = 11 (Tbx21+/+) and n = 12 (Tbx21−/−), pooled from three independent experiments. (C) Overexpression of T-bet and a T-bet mutant (T-bet Y182S) in activated Th1 cells, assessed by qRT-PCR, analyzed on day 5 postactivation. miR-148a was normalized to snU6 and presented relative to values obtained with an empty retroviral control vector (RV). Data are shown as mean ± SEM, n = 8 (RV), n = 7 (T-bet), and n = 6 (T-bet Y182S), pooled from three independent experiments. (D) Twist1 expressionin once and repeatedly activated Th1 cells, assessed by qRT-PCR, normalized to HPRT, and presented relative to values obtained for naive Th cells. Each data point represents an individual experiment, performed with n = 1 (Wilcoxon-test for paired data, *p ≤ 0.05). (E) Bim expression in ex vivo isolated Twist1fl/fl CD4-Cre+/− cells and Twist1wt/wt CD4-Cre+/− control, assessed by qRT-PCR, normalized to HPRT and presented relative to values obtained for Twist1wt/wt CD4-Cre+/−. Data are shown as mean ± SEM, n = 1, each pooled from two independent experiments. (F) miR-148a expression in repeatedly activated Twist1fl/fl CD4-Cre+/− Th1 cells and Twist1wt/wt CD4-Cre+/− control, assessed by qRT-PCR, normalized to snU6 and presented relative to values obtained for Twist1wt/wt CD4-Cre+/−. Data are shown as mean ± SEM, n = 1, each pooled from three independent experiments. (G) Twist1 binding to miR-148a locus determined by chromatin immunoprecipitation (ChIP), normalized to total DNA and presented relative to samples obtained from Twist1fl/fl CD4-Cre+/− Th1cells. Data are shown as mean ± SEM, n = 1, each pooled from four independent experiments. (B, C, and E–G) Mann–Whitney test for unpaired data, *p ≤ 0.05, **p ≤ 0.005, ***p ≤ 0.001.
