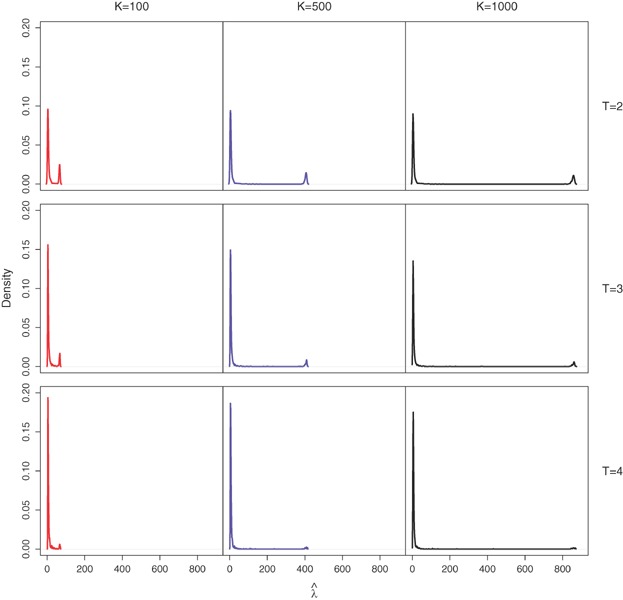
Figure 2.

Kernel density estimates of  from the Poisson N-mixture model for
  sites,
  and
and  based upon 1000 simulated datasets for
  , and
, and  . This figure appears in color in the electronic version of this article.

Kernel density estimates of  from the Poisson N-mixture model for
  sites,
  and
and  based upon 1000 simulated datasets for
  , and
, and  . This figure appears in color in the electronic version of this article.