
Figure 2.
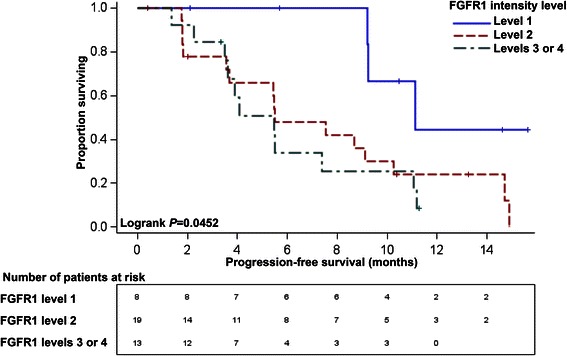
Progression-free survival curves (PFS) with number at risk stratified by FGFR1 intensity. The Ariol imaging platform was used to stratify the specimens based on intensity of in situ hybridization staining for FGFR1. Non-tumor tissue was excluded from analysis. The differences across FGFR1 intensity strata were statistically significant with better progression-free survival among those patients with the lowest FGFR1 intensity (level 1) in univariate analysis; P = 0.0452.