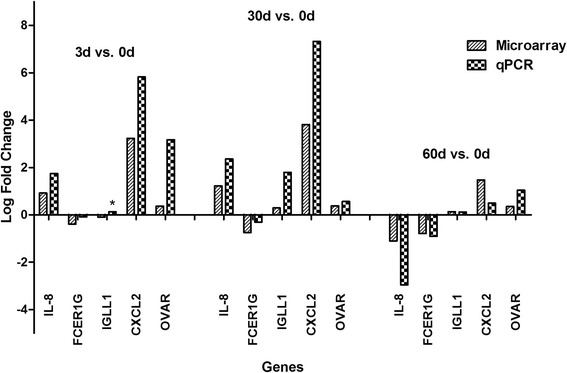
Figure 3.

Validation of gene expression by quantitative RT-PCR. Five immune-relevant genes were randomly selected for qPCR validation. The values are the mean of gene expression levels performed three times, as calculated by the △Ct method, normalized to beta-actin expression, and comparing the 3d, 30d, 60d versus 0d of each sheep respectively. A similar degree of variability in expression profiles between microarray and qPCR was observed, only with IGLL1 opposite in 3d vs. 0d comparison. Opposite expression between qPCR and microarray was marked by an asterisk.
