
Figure 3.
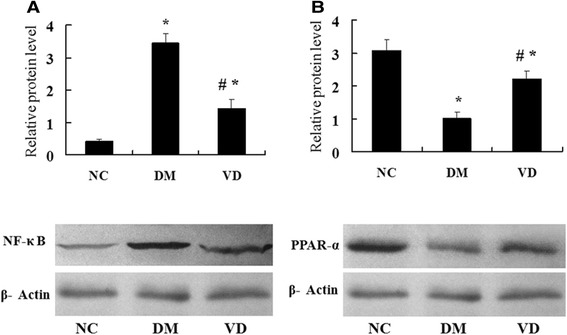
Western blot analysis of protein expression NF-κ B and PPAR-α. Representative western blot images and quantitative analysis of NF-κ B (A), PPAR-α (B). β-actin was used as a loading control. NC, normal control group; DM, diabetic group; VD, vitamin D treatment group. *P < 0 .05 vs. NC; #P < 0 .05 vs. DM.