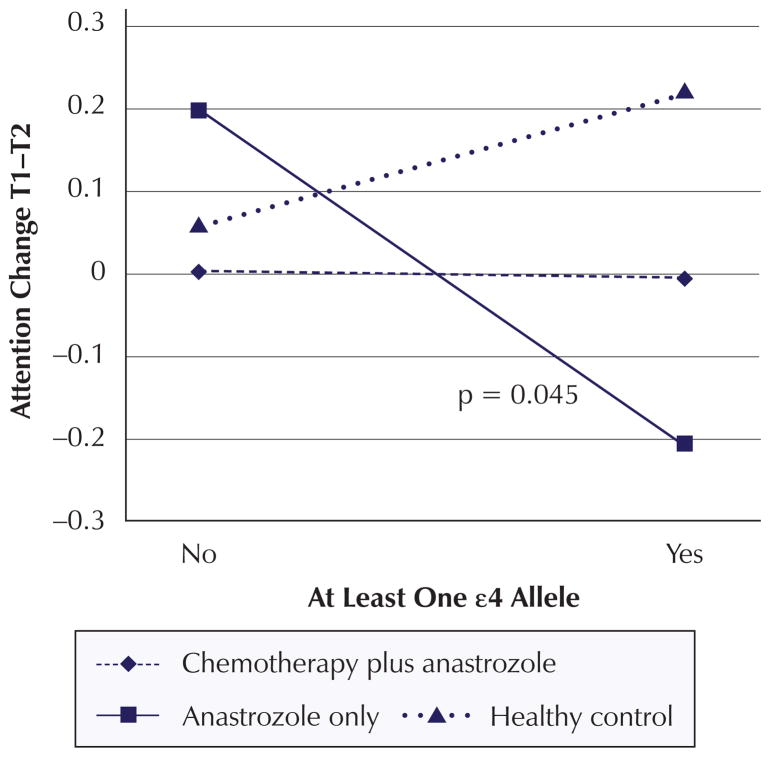
Figure 3. Mean Z Scores for Interaction Effects: Attention Change.
Note. Mean Z scores were calculated for each apolipoprotein E ε4 status and treatment combination based on mean covariate and confounder values. P values for the significant or marginally significant interactions are displayed in each graph.

