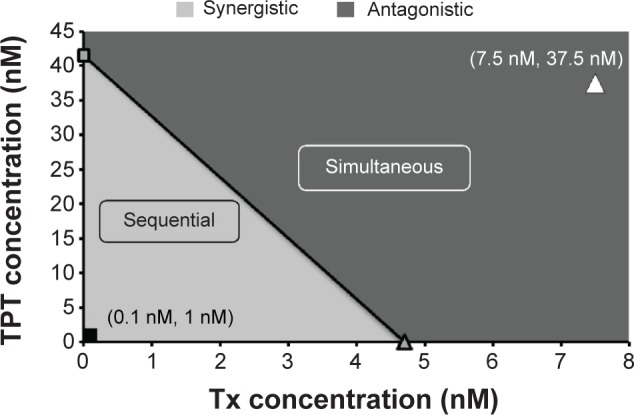
Figure 3.

Isobologram of TPT and Tx on NCI-H460 cells demonstrating equitoxic doses of TPT and Tx either alone or in combination (simultaneous or sequential).
Notes: The diagonal line connects IC50 values of TPT and Tx and represents zero interaction isoboles. Values on the right side of the diagonal line indicate an antagonistic interaction between the drugs (simultaneous treatment), while those on the left side of the diagonal line indicate a synergistic interaction (sequential treatment).
Abbreviations: IC50, half maximal inhibitory concentration; TPT, topotecan; Tx, paclitaxel.
