
Figure 3.
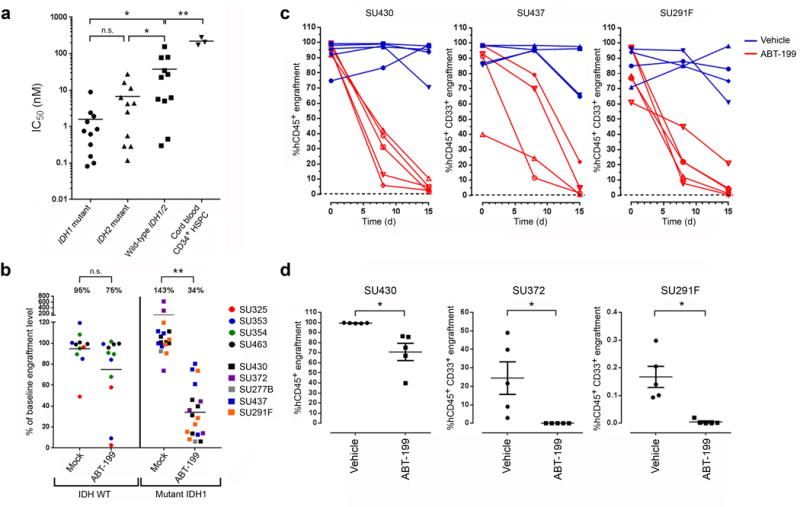
ABT-199 targets IDH1/2 mutant primary human AML cells. (a) ABT-199 IC50 values of FACS-purified AML blasts (n = 11 for each group) and CD34+ enriched cord blood HSPCs (n = 3). (b) Change in AML bone marrow (BM) engraftment level relative to baseline in NSG mice transplanted with the indicated primary human AML samples and treated with either vehicle (mock) or ABT-199 daily for seven consecutive days. Each data point represents an individual mouse (n = 11 for the mock-treated WT IDH1/2 group; n = 12 for the ABT-199–treated WT IDH1/2 group; n = 17 for the mock-treated mutant IDH1 group; n = 18 for the ABT-199 treated mutant IDH1 group). (c) AML BM engraftment levels in NSG mice transplanted with the indicated primary samples and treated with vehicle or ABT-199 daily for 14 consecutive days (days 1–14). Each line represents serial measurements from an individual mouse. (d) AML BM engraftment levels in secondary NSG recipients 7 weeks after transplantation with BM cells obtained from primary NSG recipients that were engrafted with the indicated IDH1 mutant samples and treated with vehicle or ABT-199 for 7 consecutive days (SU372), 14 consecutive days (SU291F), or 21 consecutive days (SU430). Each data point represents an individual mouse. All horizontal lines represent the mean. All error bars represent sem. NS, not significant. *P ≤ 0.05, ** P < 0.001. Statistical significance (P) was determined by Student’s t-test.