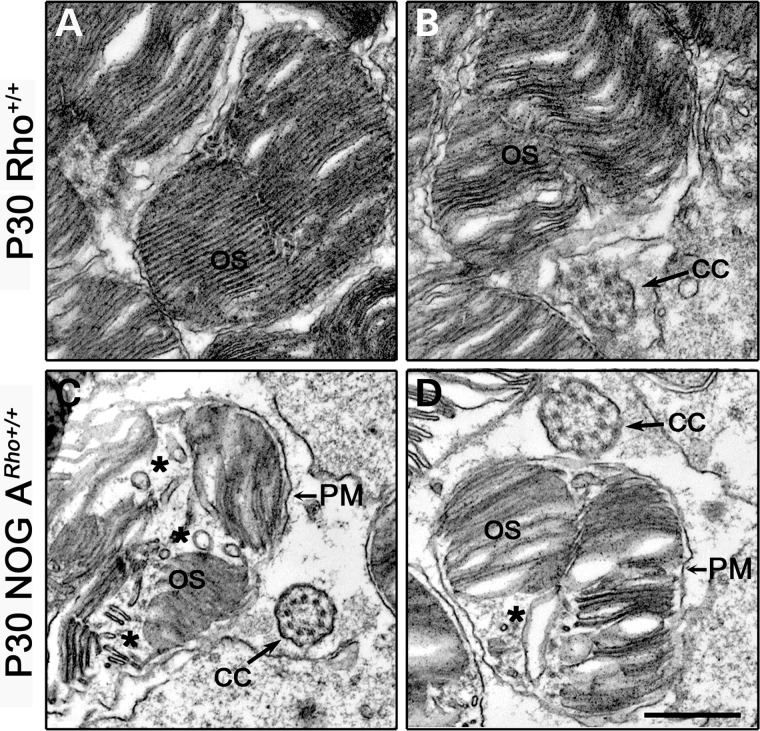
Figure 5.
Outer segment cross sections of the NOG A retina. (A and B) Two examples of electron microscopic images of cross sections of a Rho+/+ retina at P30. (C and D) Two examples of electron microscopic images of cross sections of a P30 NOG ARho+/+ retina. The asterisks denote vacuole formation in the OS. Scale bar is 500 nm. CC, connecting cilium; PM, plasma membrane; OS, outer segment.

