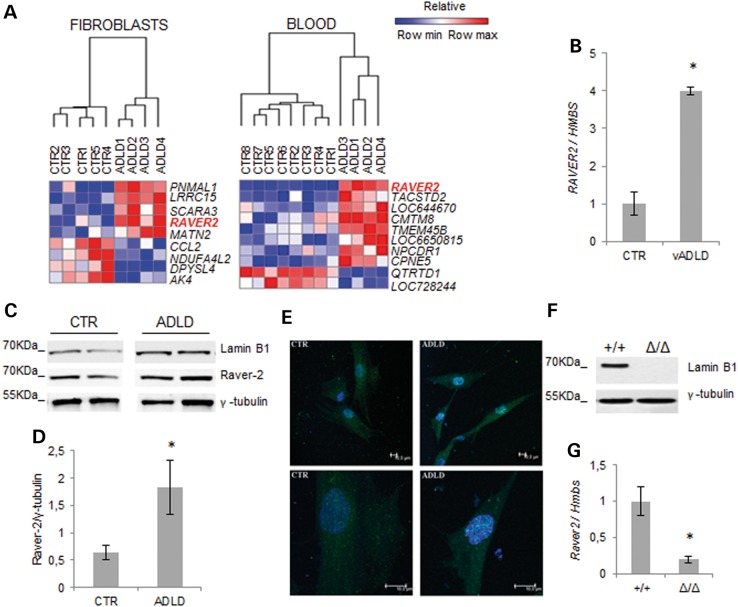
Figure 2.
RAVER2 expression varies as a function of lamin B1 levels. (A) HeatMap of DEGs with statistically significant changes (FDR-adjusted P-value smaller than 0.05) in fibroblasts (ADLD, n = 4; CTR, n = 5) and blood (ADLD, n = 4; CTR, n = 8). The GENE-E software (http://www.broadinstitute.org/cancer/software/GENE-E/) was used to generate the heatmaps. (B) Quantitative analysis of RAVER2 mRNA in vADLD and CTR fibroblast samples. The RAVER2 mRNA levels were normalized to HMBS mRNA expression. Bars represent the mean relative expression ± SD of one vADLD (two different batches of cells from the same donor) versus fibroblasts from six CTRs. *P < 0.05, Student's t-test. (C) Representative western blot of lamin B1 and raver-2 in fibroblasts from two ADLD patients and two CTRs. γ-Tubulin was used as loading control. (D) Quantitative analysis of raver-2 protein levels in fibroblasts from ADLD patients (n = 4) and age-matched CTR subjects (n = 4). The data are normalized to γ-tubulin and expressed as percentages of CTR levels. Bars represent average ± SEM. *P < 0.05, Mann–Whitney Rank Sum test. (E) Representative confocal images of primary fibroblasts from one ADLD patient and one age-matched CTR immunodecorated against raver-2 (green). Nuclei are counterstained with 2-(4-amidinophenyl)-6-indolecarbamidine dihydrochloride. Scale bars: 10 µm. (F) Representative western blot of lamin B1 protein expression in brain of Lmnb1+/+ and Lmnb1Δ/Δ E18.5 embryos. (G) Raver2 mRNA expression in brain of E18.5 mouse embryos analyzed by RT-qPCR. *P < 0.05, Student's t-test.

