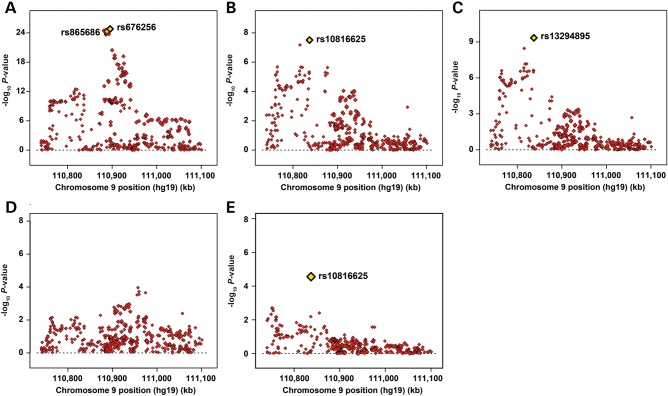
Figure 1.
Regional association plots for 9q31.2 fine-mapping SNPs in European and Asian ancestry individuals. (A–D) Individual steps from a forward stepwise regression analysis using data from the Caucasian studies, in which the most strongly associated SNP from a given model is included as a covariate in the subsequent model. Chromosome position is indicated on the x-axis, and –log10 P-value on the y-axis. The models represented are adjusted for study and seven ancestry-informative principal components. Each directly genotyped SNP is represented as a single red diamond and the most significant SNP that attained genome-wide significance from each step of the stepwise regression is indicated by a yellow diamond. (E) Regional association plot for the 9q31.2 fine-mapping SNPs in subjects with Asian ancestry tested using a model adjusted for study and two ancestry-informative principal components.

